What is One-Way ANOVA? How to Calculate it?
Published by at September 2nd, 2021 , Revised On August 7, 2023
For many, statistical analysis is not an easy concept to grasp. ANOVA, one of the hypothesis testing techniques, is one of those concepts that many find challenging to learn. However, the ANOVA and its types are not as difficult to pick up as they are widely understood.
Anyhow, If you are one of those challenged students, do not worry. Here is a precise explanation of what one-way ANOVA is and how it is calculated. But before diving into One-way ANOVA, let us get an overview of the broad term ANOVA.
Overview:
What is ANOVA?
ANOVA is the short form of Analysis of Variance, a popular and commonly used hypothesis testing technique. Precisely, this test helps in finding out if the results of the research are significant or not. The process of the ANOVA test incorporates comparing and finding variance in the means of two or more independent datasets.
The scope of ANOVA is significant in research as it helps to pinpoint how independent variables affect the dependent variables. Moreover, it allows you to either reject a null hypothesis or accept the alternate hypothesis based on the variance. ANOVA is calculated by finding the ratio of variance within the groups and variance between the groups.
ANOVA is categorized into two main types:
In this article, we will talk only about One way ANOVA.
One-way ANOVA:
Definition:
One-way ANOVA test is a kind of ANOVA that aims to find if there is a significant statistical difference among the means of two or more independent groups.
Explanation:
One-way ANOVA is a major type of ANOVA, also called One-factor ANOVA, One-way analysis of variance, and Between Subjects ANOVA. As the name suggests, one-way ANOVA is a unidirectional ANOVA that analyses the impact of one factor-independent variable.
Though it considers only one independent variable, there is more than one level of the independent variable that it accounts for. It segments one independent variable into multiple levels. For example, social media consumption is one independent variable that can be divided into multiple levels low, medium, and high levels.
This test aims to compare two or more independent groups and find whether there is a statistical difference between the means of those groups. One thing to remember is that one-way ANOVA is an omnibus test. It means that it can only tell you that the groups are statistically different but does not tell you specifically which groups are different.
You may have three, four, five, or even more groups, and by carrying out this test, you will only find if there is a difference in the groups and not exactly which groups have the difference.
The variables that One-way Annova uses are:
- Dependent Variables:
These are the kind of variables that depend on other factors in an experiment. They change with the manipulation of other variables. For example, how stress influences mental health. Mental health is a dependent variable that depends on stress.
- Independent Variables:
Independent variables remain unaffected by any manipulation of a factor of the experiment. These variables have an individualistic and independent character. In fact, they affect the dependent variable in an experiment. From the aforementioned example, stress is the independent variable as it affects the dependent variable: Mental health.
Assumptions of One-way ANOVA:
The assumptions of one-way ANOVA are similar to ANOVA, with a few exceptions.
- The sample is taken from a normally distributed population
- Each sample is drawn independently.
- The data shows homogeneity of variance.
- The dependent variable must be continuous that can be measured on a scale that can be subdivided.
When to use One-way ANOVA?
You can use one-way ANOVA when your data has:
- One categorical independent variable
- One quantitative dependent variable.
In statistics, a categorical variable is a variable that has multiple categories. For example, skin colour is a categorical variable with multiple white, black, and brown categories. The independent variable needs to have multiple levels or categories as they are the main focus of this test. By multiple, it means more than two groups, as two groups can be compared through a T-test.
Examples of One-way ANOVA:
Example 1:
Suppose you are studying the impact of CBD oil on weight loss. You will categorize the people into groups consuming Isolate CBD, Full-spectrum CBD, and Broad spectrum CBD. In this condition, the categorical independent variable is CBD, which has three categories, and the dependent variable is weight loss.
Example 2:
Suppose you are studying the time of running on a running track by different weighted people. In that case, you can use a one-way ANOVA test to find if the people of different levels of weight have significant statistical differences. Weight is a categorical independent variable with levels of underweight, normal, overweight, and obese; the running time is a dependent variable.
The difference between one and two-way ANOVA:
One way and two-way, the names themselves somehow explain that they are different from each other. While one-way ANOVA is a test that compares the means of multiple categorical independent groups to check that they are significantly different, two-way ANOVA helps to analyze the effect of two independent variables on a continuous outcome variable.
In simple words, it evaluates how the mean of the variables changes with the changes in the categories of the categorical independent variables. The two-way ANOVA examines the effect of independent variables as well as the relationship to the outcomes. Whereas the one-way ANOVA simply suggests if the groups have significant statistical differences. The collected data must have at least one categorical independent variable and one quantitative dependent variable for carrying out a one-way ANOVA test.
On the other hand, to use a two-way ANOVA, the collected data must have a dependent variable at different levels of two categorical independent variables. It helps to find how the independent variables collectively impact a dependent variable.
Is the Statistics assignment pressure too much to handle?
How about we handle it for you?
Put in the order right now in order to save yourself time, money, and nerves at the last minute.
Calculating one-way ANOVA:
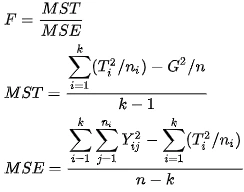
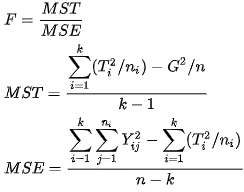
The formula for calculating one-way ANOVA is:
Keys:
F: The variance ratio of the overall test.
MST: Mean square due to treatment groups(Between groups)
MSE: Mean square due to error(Within the groups)
Yij: It is an observation.
Ti: It is a group total
G: Grand total of all observtions.
Computing One-way ANOVA by hand:
Let’s take the example of four groups of a class(Red, blue, green, and yellow) that scored different marks in the tests to calculate one-way ANOVA by hand.
Step 1: Calculate the group mean and overall mean.
Group means:
| Red | 9 |
|---|---|
| Blue | 7.6 |
| Green | 6.6 |
| Yellow | 9.6 |
| Overall mean: 8.2 |
Step 2: Calculate the regression sum of squares(SSR) by using the formula:
N: Sample size of group j
Xj: Mean of group
: Overall mean
5(9-8.2)2+ 5(7.6-8.2)2+5(6.6-8.2)2+ 5(9.6-8.2)2
= 5(0.8) 2+ 5(-0.6) 2+ 5(-1.6) 2+5(1.4) 2
= 5(0.64)+5(0.36) + 5(2.56)+5(1.96)
= 3.2+ 1.8+12.8+9.8
SSR = 27.6
Step no.3: Calculate the error sum of squares (SSE):
We will next find SSE using the formula:
Xij: the ith observation in the group j
: the mean of group j
Red: (9-9) 2+(10-9) 2+(8-9) 2+ (9-9) 2+ (9-9) 2 = 2
Blue: (7-7.6) 2+(8-7.6) 2+(6-7.6) 2+(8-7.6) 2+(9-7.6) 2= 5.2
Green: (5-6.6) 2+(6-6.6) 2+(7-6.6) 2+(7-6.6) 2+(8-6.6) 2= 5.36
Yellow: ( 10-9.6) 2+(10-9.6) 2+(9-9.6) 2+(9-9.6) 2+(10-9.6) 2= 1.2
SSE= 2+5.2+5.36+1.2
SSE = 13.73
Step no. 4: Calculate SST:
We will now calculate the sum of squares through the formula:
SST= SSR + SSE
= 27.6+ 13.73
= 41.33
Step no. 5: Fill the ANOVA table
| Source | Sum of Squares | df | Mean Squares | F |
|---|---|---|---|---|
| Treatment | 27.6 | 4 | 6.9 | |
| Error | 13.73 | 16 | 0.858 | |
| Total | 41.33 | 19 | 2.175 | 8.05 |
Df treatment is calculated with the formula: k-1, where k= number of groups.
Df Error: n-k, where n= number of observations.
Mean square treatment= SST/ df treatment
Mean square error= SSE/ df error
F= MS treatment/ MS error
The value of the F test statistic is 8.05, and comparing it to the F critical value, which is 3.004(according to the F distribution table), we come to realize that the F test statistic value is higher than the F critical value. As a result, we can reject the null hypothesis. It means that there is a significant statistical difference between the groups.
FAQs About One-Way ANOVA
One-way ANOVA is a major type of ANOVA, which is also called One-factor ANOVA, One-way analysis of variance, and Between Subjects ANOVA. As the name suggests, one-way ANOVA is a unidirectional ANOVA that analyses the impact of one factor.
Though it considers only one independent variable, there is more than one level of the independent variable that it accounts for. It segments one independent variable into multiple levels.
While one-way ANOVA is a test that compares the means of multiple categorical independent groups to check that they are significantly different, two-way ANOVA helps to analyze the effect of two independent variables on a continuous outcome variable.
In simple words, it evaluates how the mean of the variables changes with the changes in the categories of the categorical independent variables. The two-way ANOVA examines the effect of independent variables as well as the relationship to the outcomes.
Whereas the one-way ANOVA simply suggests if the groups have significant statistical differences. The collected data must have at least one categorical independent variable and one quantitative dependent variable for carrying out a one-way ANOVA test.
On the other hand, to use a two-way ANOVA, the collected data must have a dependent variable at different levels of two categorical independent variables. It helps to find how the independent variables collectively impact a dependent variable.
You can use one-way ANOVA when your data has:
1. One categorical independent variable
2. One quantitative dependent variable.


