Everything You Need to Know About T-Distributions
Published by at September 2nd, 2021 , Revised On February 10, 2023
T-distribution, popularly known as the student’s T-distribution, describes the probability of data. Although it looks similar to a normal distribution with a bell curve, it has a lower height and a broader curve. A t-distribution has the most significant number of observations closer to the mean and is commonly used when there is a small sample size and an absence of variance. A t-distribution is denoted with a ‘t.’
Why Use the T-Distribution?
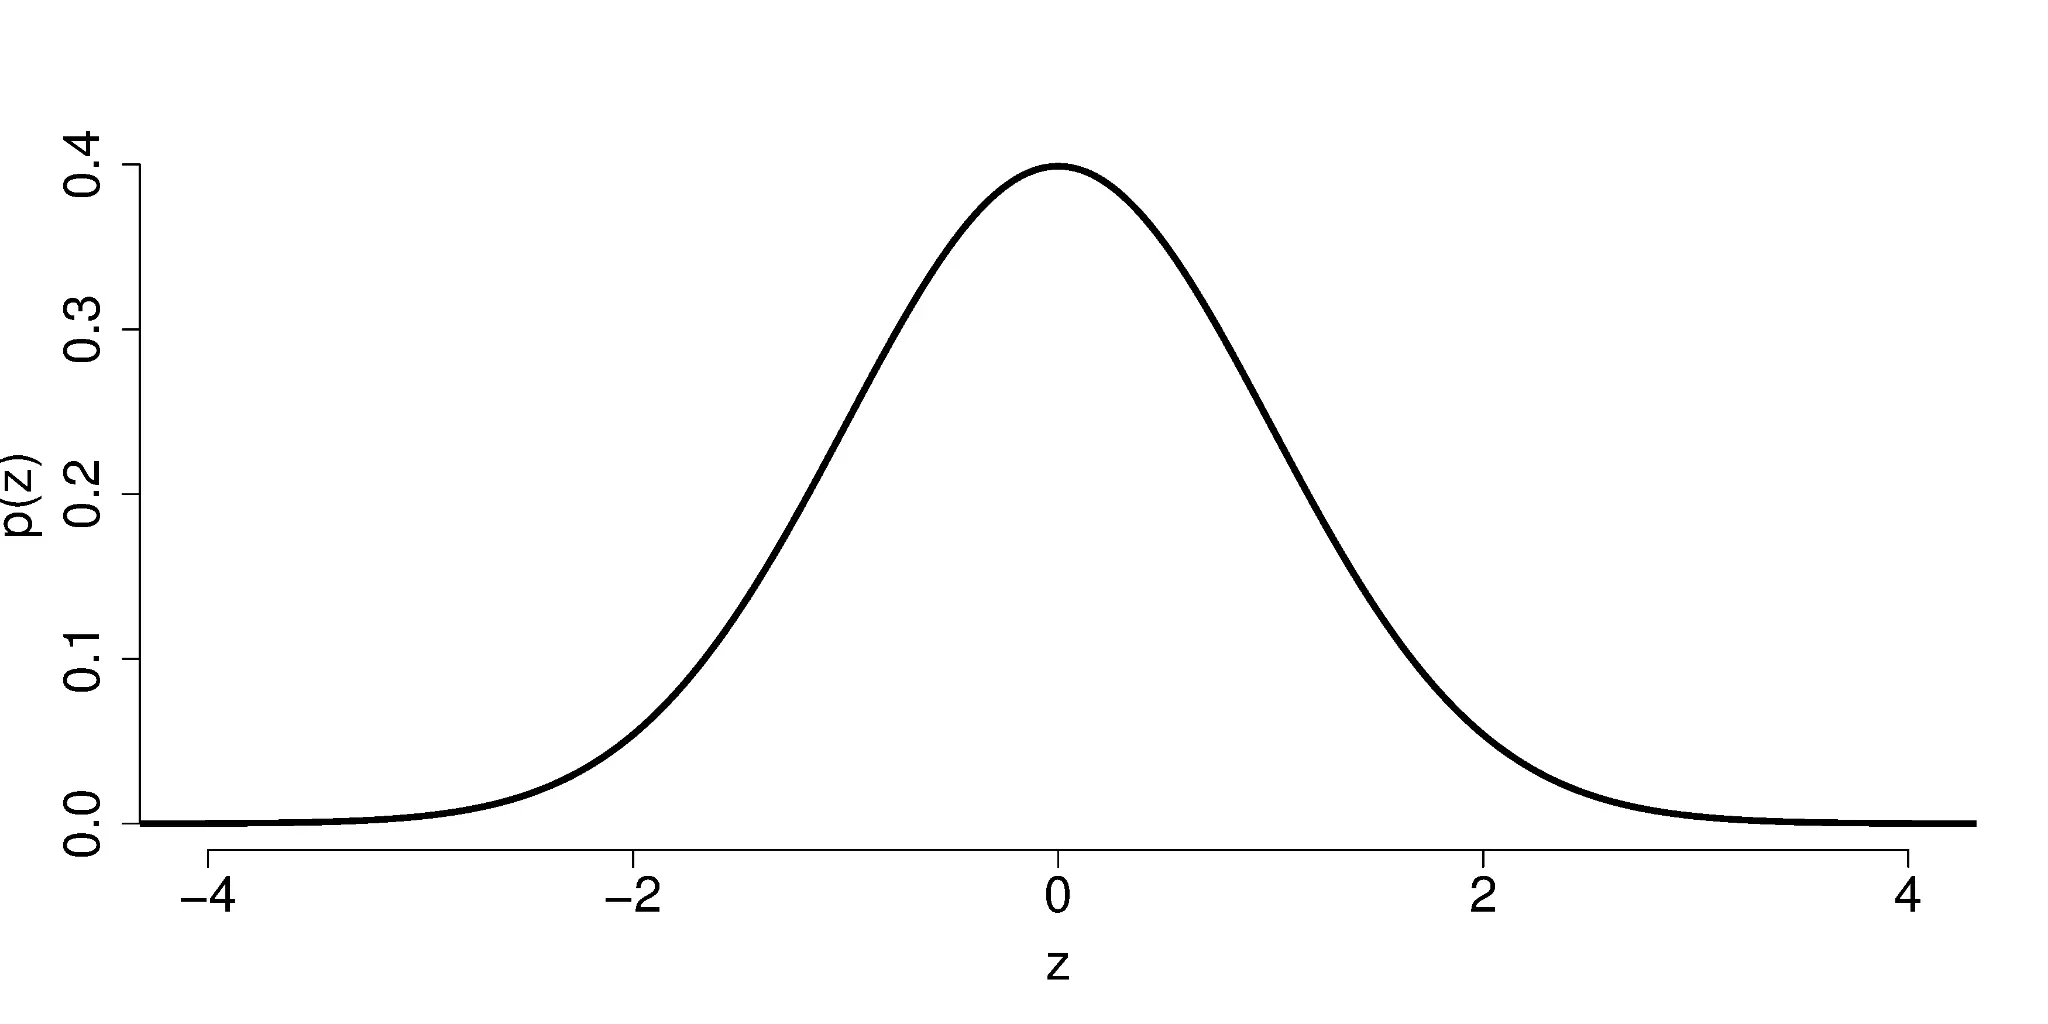
Usually, when the sampling distribution of statistics, such as the mean, is large, a normal distribution is used. In this case, we know the standard deviation of a population and can calculate the z-score.
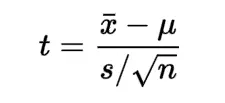
However, in cases when the sample sizes are relatively small, or we do not know the standard deviation of our data, we use a t score, computed by the following formula,
Where,
t is the T-distribution
x̄ is the sample mean
μ is the population mean
s is the standard deviation
n is the sample size
Difference Between a T-Distribution and a Standard Normal Distribution
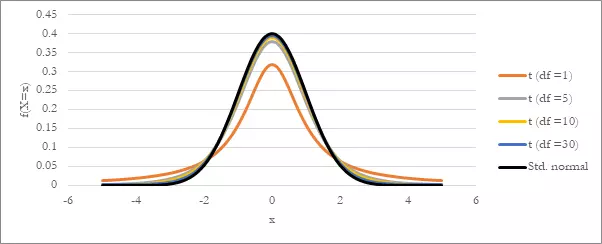
The difference between a t-distribution and a standard normal distribution mainly occurs due to the difference in sample size. Look at the graph below,
You will notice how the graphs of the t-distribution are similar to a standard normal distribution. The only difference between the two is that the t-distribution is broader and lower. Furthermore, a t-distribution has a larger standard deviation.
A significant parameter of the t-distribution is the number of degrees of freedom. In this example, the graph with the degrees of freedom as 30 is almost a standard normal distribution. You can notice how as the degrees of freedom increase, the t-distribution starts to look more like a standard normal distribution. In simple words, the shape of each t-distribution curve depends on its degrees of freedom.
Degrees of Freedom
There are several types of t-distributions. The form of a t-distribution is determined by its degree of freedom. They are the maximum independent pieces of observations given in a set of data. Degrees of freedom are denoted with a ‘df.’
When calculating the mean score, the independent observations can be calculated by subtracting one from the sample size. Therefore, we can say that degrees of freedom are n – 1.
For example, if a sample size of distribution is given to be 10, we would say that there are 10-1 or 9 degrees of freedom in the t-distribution. Similarly, if a t-distribution has a sample size of 20, the degrees of freedom would be 20-1 or 19.
df = n -1
Some Properties of a T-Distribution
The following are the properties of t-distribution statistics:
- Like a normal distribution, a t-distribution has a bell-shaped curve.
- The shape of the t-distribution changes when degrees of freedom change.
- The variance is always greater than one and is equal to v / (v – 2), where v, the degrees of freedom is > 2
- As the sample size increases, the t-distribution starts to look more like a normal distribution.
When to Use a T-Distribution?
A T-distribution can be used when one or more of these conditions apply:
- The population distribution is normal
- The sample size is at least 30 and is symmetrical.
- The sample size is a little skewed and is at least 40
Note: A t-distribution should not be used for small sample sizes.
Let’s Look at Some Examples of T-Distribution
Example: Let’s say a bicycle’s tire company says that their average tire can go on for 1000kms. You select 20 tires for testing. The chosen sample lasts an average of 950 km, after which they require changing, with a standard deviation of 60 km. Find the t-statistics.
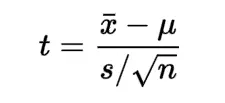
Solution: To calculate the t-statistics, we will use the following formula,
Where,
t is the T-distribution
x̄ is the sample mean
μ is the population mean
s is the standard deviation
n is the sample size
t = 950-1000 / 60 / √20
t = -50 / 13.417
t = – 3.727
Example: A med school claims that all its first-class graduates earn an average of $500 per month. You want to test it out and randomly select 20 of the first-class graduates from this school. You find out that its graduates earn $490 on average per month, with a standard deviation of $60. Assuming what the med school claimed was true, what is the probability that the mean pay of the med school graduates is no more than $490?
Solution: By using the formula for t-statistics, we’ll get,
x̄ is $490
μ is $500
s is $60
n is 20
t = 490 – 500 / 60 / √20
t = -10 / 13.417
t = -0.745
The degree of freedom would be 20 – 1 = 19
Calculating the probability using the t-table, we’ll get 0.2327 or 23.27%
Therefore, the probability that the mean pay of the med school graduates is no more than $490 is 23.27%
Key Takeaways
- T-distributions are used when the sample size is small, and there is no variance.
- T-distributions look similar to a standard normal distribution, except they are wider and lower.
- Degrees of freedom can be calculated by subtracting one from the sample mean. df = n-1
- The shape of a t-distribution’s curve changes with its degrees of freedom.
FAQs About T-Distributions
Both the t-distribution and the standard normal distribution are similar. However, a t-distribution has more probability in the tails of its curve and is based on the sample standard deviation.
The first step is to find the t-statistics using the following formula,
Where,
t is the T-distribution
x̄ is the sample mean
μ is the population mean
s is the standard deviation
n is the sample size
Once this is calculated, subtract one from your sample size. This will be your degree of freedom.
Lastly, look at your t-score and the df in the t-distribution table.
A t-score is an indication of how many standard deviations away a number is from the mean. It is used when a sample is small, i.e., under 30.


